
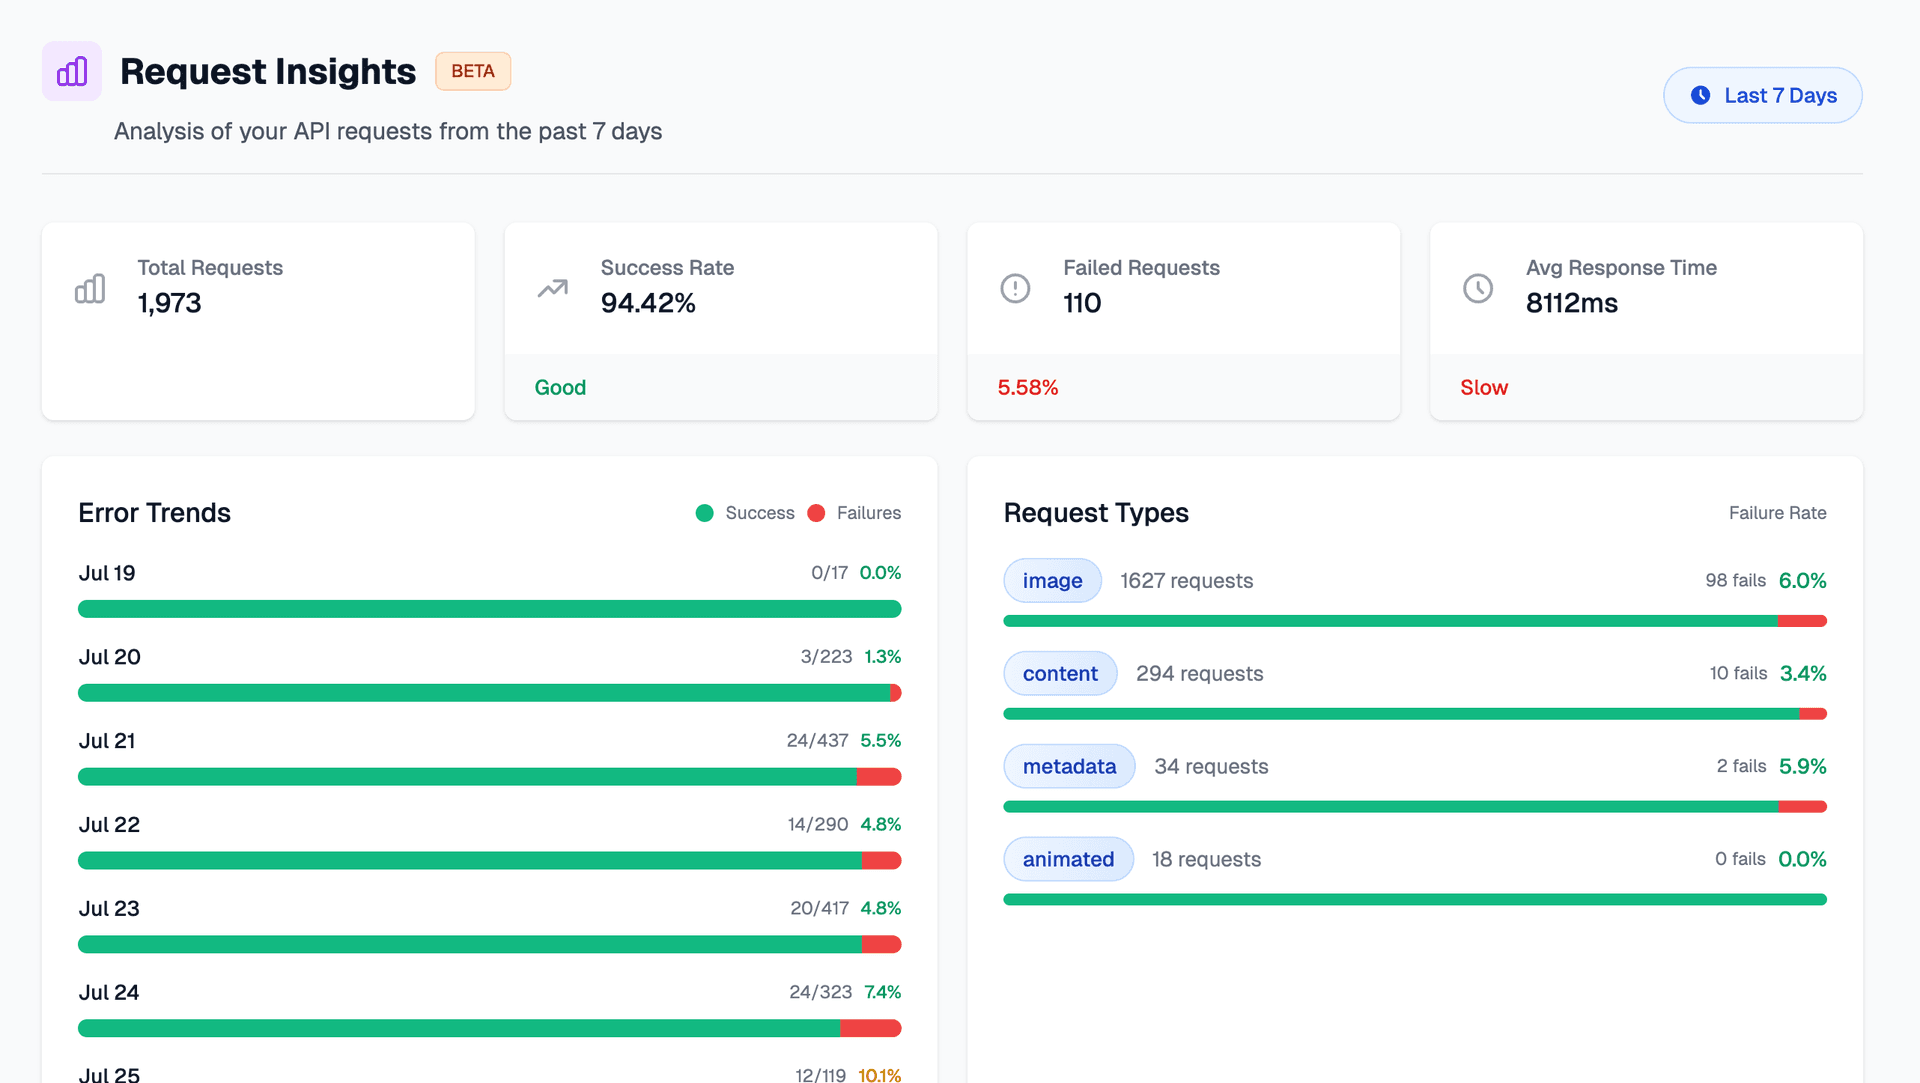
We’ve introduced a new “Request Insights” feature to help you better understand your API usage and performance. With this dashboard, you can now view detailed analytics for your API requests from the past 7 days, including:
- Total number of requests
- Success and failure rates
- Average response times
- Error trends over time
- Breakdown by request type (image, content, metadata, animated)
- Most common errors and problem URLs
Use these insights to monitor performance, identify bottlenecks, and optimize your workflows. This feature is currently in beta—your feedback is welcome!